 Responses from 59 leaders (primarily Perioperative Directors and VPs) representing organizations across the country paint a compelling picture in our 2017 Fall survey.
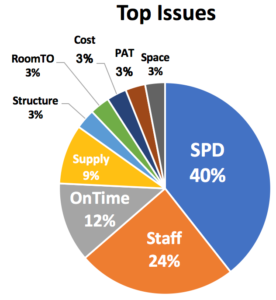
The message was loud and clear about overall priorities: when asked the open-ended question “What is the top issue making your work like harder than it needs to be?”, 40% of respondents placed Sterile Processing and instrument issues at the top of their list. There is good news: sterile processing can be a highly reliable, well-oiled machine. Stay tuned over the coming weeks for a special series focused on improving sterile processing and instrument flows (see our Kingston General case study for a sneak peak).
Responses to other detailed questions are below.
How do you compare? Are you inline with the trends, or are you facing a unique challenge? Are you looking for help to either stay at the head of the pack or start raising the bar? Let us know!
Sterile Processing
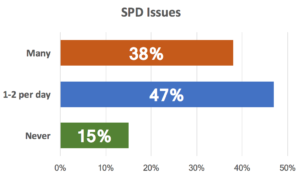 Instrumentation issues are one of the most frequent topics of conversation when we speak with surgical service teams. Whether the issue is timeliness of turnaround, having the right instruments available, completeness of sets when opened, or contamination, these problems eat up vast amounts of time and energy and add real cost to the system. It doesn’t have to be this way!
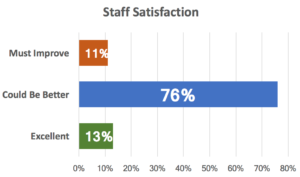
Staffing
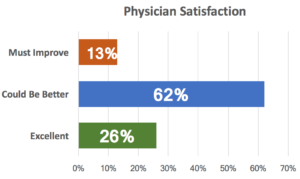
After sterile processing, staff issues were the next most frequent issue. Only 13% of respondents rated staff satisfaction as “Excellent”, with physician only slightly better.
Staff and provider satisfaction are directly driven by two key factors: how well things work and how people are treated. By engaging people in process improvement, we can improve both!
On-Time Starts
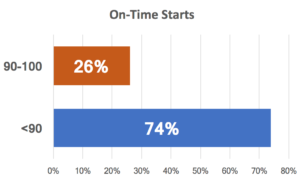 Nearly 3 out of 4 facilities indicated that they are at or below (sometimes far below) 90% on-time starts. The ripple effects last all day, delaying cases, causing havoc, and raising tensions.
There are lots of opinions, but do you really know what is causing late starts? Or is everyone just pointing fingers at each other?
Improvement requires good root cause analysis into the real reasons for your issues. At Opus Solutions, we use a data-driven Assessment process to remove the bias and personalities from the equation and focus the conversation on facts and solutions that will make an impact.
Room Turns
 More than half of those surveyed have room turns between 20-35 minutes. And 1 out of 10 facilities is over 35 minutes.
Noteworthy is that these responses were from operational leaders that often define room turn time as patient out to patient in. If we asked surgeons or anesthesiologists, what would they say? Each stakeholder has a different perspective and often a key step towards improving is to align on simple things like how you measure room turn times and where different people enter and leave the process.
We see a lot of different room turn practices and have helped our clients improve dramatically. A good room turn is like a work of art. A lot of detail and skill go into creating a reliable system.
Space
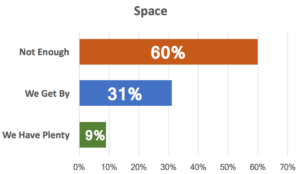 It is no surprise to see 60% of your peers said that they do not have enough space, and another 31% have barely enough. Only 9% feel that they have plenty. Nearly every OR we have worked in believes that they need more space – and nearly every one of them has vast untapped capacity and hundreds (or thousands) of square feet of space eaten up by hidden process, supply, and other system issues that are entirely solvable. We’ve help our clients turn those inefficient practices into space and capacity.
New space is often quickly squandered with old practices. Before you spend millions to renovate, expand, or build, wouldn’t you like to know what hidden capacity may already be within reach?
Help is Here!
Want more information on any of these topics? Want to bring your team to new heights? We are here to help.